


Check your league's overall roto standings and you will find your team sitting somewhere in the middle, a rank that feels like it says something definitive about how the season is going. It does not. Overall points average performance across every category into one number, and that averaging is exactly what hides the real story: most mid-table teams are not actually mid-table everywhere. They are one or two categories away from moving up, and the standings page will never tell you which ones.
Running a category-by-category audit instead of trusting the overall number is the single highest-leverage thing a roto manager can do heading into the stretch run. Here is how to run it, how to tell a real opportunity from a mirage, and how to fix what you find without blowing up your roster to do it.
Why Your Overall Rank Is Lying to You
Roto scoring sums your rank in every category into a single point total, which means a team that is dominant in saves and disastrous in stolen bases can land in the exact same overall spot as a team that is mediocre everywhere. The overall number treats those two rosters as equivalent. They are not. One of them has a real, fixable problem in a single category. The other has no obvious lever to pull at all.
The category most managers skip when they only glance at the standings page is the one with the smallest raw numbers, saves or steals in shallower formats, where a gap of two or three counting stats can be the difference between fourth place and first in that column alone. It is easy to miss because the number looks small. It is often the cheapest gap on the board to close.
Running the Category Gap Audit
The method is mechanical on purpose. List every scoring category. Next to each one, write your current rank, the point gap to the team directly above you, and the raw statistical gap behind that point gap, home runs behind, ERA points behind, whatever the category measures. Flag anything within a spot or two, or within a margin your roster could plausibly move before the season ends.
Re-run it every two to three weeks rather than once and forgetting about it. Category standings move constantly as teams get hot or cold, hitters get healthy, and streaming pitchers cycle through active rosters, so an audit from a month ago is already stale. The trade deadline is the hard deadline to have run it at least once, but treating it as a recurring check rather than a single pre-deadline exercise is what actually catches a flippable category before a rival closes the gap first.
Buy Skill, Not Hot Streaks

USA TODAY Network via Reuters Connect
Once the audit flags a flippable category, the next question is whether the player you would trade for is actually good, or just hot. A category gap driven by a sustainable skill indicator, strikeout rate, walk rate, barrel rate, is worth trading for. A gap propped up by an unsustainable BABIP or a hot two weeks is not, and paying a real trade package for it is how a roto season gets away from a manager in August.
Kyle Harrison is the clearest live example on the pitching side. His ERA sits at 5.34, the kind of number that gets a pitcher left on waivers in most leagues. His xERA is 3.05, a gap of better than two full runs, and his K-BB% (strikeout rate minus walk rate, the cleanest single-number skill check for a pitcher) is 25.2 percent, the best mark of any starter carrying an ERA that ugly. That is not a command problem. That is variance sitting on top of a legitimately good arm, and it is exactly the gap this audit is built to find before the ERA corrects and the price goes up.
He is not an isolated case. The table below ranks every starter with at least 20 innings, an xERA of 4.25 or better, and an ERA still running above that number, sorted by K-BB%. A few of these names, Jacob deGrom, Paul Skenes, Gerrit Cole, are not hiding from anyone. That is useful information on its own: the audit does not just surface waiver-wire names, it also tells you which of your own rostered arms are further from a correction than their ERA suggests.
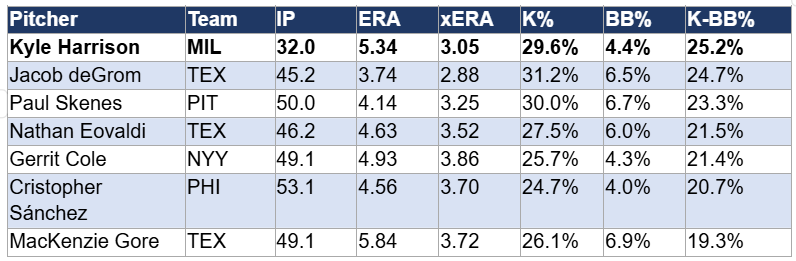
A couple of names just off this list deserve a mention with a caution attached rather than a spot in the table. Grant Taylor and Cionel Pérez both post a K-BB% north of 20 percent with real ERA-xERA gaps, but on innings totals thin enough, 21.2 and 20.2 respectively, that one bad start moves the numbers meaningfully. Treat them as names to monitor, not the headline case. Bryan Woo shows the same shape at 19.3 percent K-BB%, but his walk rate is trending the wrong direction, so confirm the command is holding before trading for the correction.
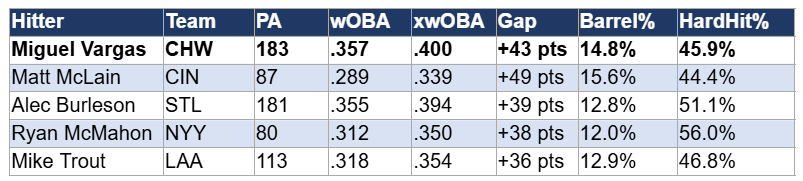
The same logic runs on the hitting side, with barrel rate as the skill indicator in place of K-BB%. Miguel Vargas is the clearest current case: a .357 wOBA against a .400 xwOBA over 183 plate appearances, with a 14.8 percent barrel rate and a 45.9 percent hard-hit rate that both sit well above average. The surface batting line has not caught up to the quality of contact yet, which is precisely the kind of gap worth targeting in a batting average or power category rather than chasing a hitter on a two-week streak with nothing underneath it.
The rule runs in both directions regardless of which side of the ball you are looking at. A gap built on strikeout rate, walk rate, or barrel rate is a skill gap, and skill gaps close. A gap built on BABIP or strand rate is a hot streak, and hot streaks end. Check which one you are looking at before you spend a trade finding out.
Fix It One Trade at a Time

Charles LeClaire-Imagn Images
Once the audit identifies a flippable category and a skill-backed target, resist the urge to solve the whole board in one trade. A single targeted deal aimed at one category has a contained downside: if the return underperforms, one category suffers. A blockbuster built to fix three categories at once risks all three if the centerpiece piece gets hurt or slumps, and roto rosters rarely have the depth to absorb that kind of miss this late in the season.
The tipping point for abandoning the incremental approach and considering a bigger trade is when the audit turns up three or more flippable categories that all trace back to the same roster weakness, a rotation that cannot miss enough bats, an outfield with no power. At that point a single, larger move addressing the shared root cause can be more efficient than three separate smaller trades chasing the same problem from different angles. Short of that, smaller and more targeted beats bigger and broader.
Worked Example: Reading the Audit on a Real Roster
Illustrative composite roster, not drawn from a specific identifiable league. Replace with your own team's real standings when running this audit yourself.
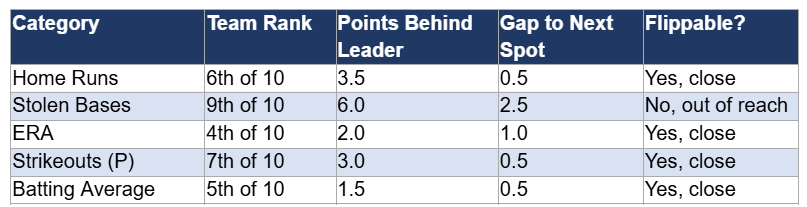
Four of the five categories in this composite are within a single roster move of flipping, and only stolen bases is genuinely out of reach given the size of the gap. The audit points to two moves worth prioritizing: a strikeout-heavy arm who clears the half-point gap in that category, and a hitter whose skill indicators back up a modest average boost, evaluated with the same skill-over-streak filter above before any deal gets made. Stolen bases gets punted rather than chased, since 6.0 points behind with a 2.5-point gap to the next spot up is not closing before the season ends regardless of what gets added.
Questions About Your Category Gap Audit, Answered
How is a category gap audit different from just checking my overall standings?
A category gap audit looks at each scoring category individually instead of relying on the overall roto total. Teams with the same overall rank can have very different strengths and weaknesses, and breaking down every category helps identify the one or two areas that are realistically within reach of gaining points.
How do I tell if a category gap is worth trading for?
Focus on gaps supported by sustainable skill indicators such as strikeout rate, walk rate, or barrel rate rather than short-term production fueled by a hot streak. Skill-based performance is more likely to hold over the rest of the season, making those players better trade targets.
Why one trade at a time instead of a bigger deal?
A targeted trade limits the downside because it is designed to improve one specific category. A blockbuster intended to solve multiple weaknesses at once carries greater risk if the key player underperforms or gets hurt, potentially hurting several categories instead of one.
How often should I run this audit?
Run it at least before the trade deadline, but repeating it every two to three weeks is more effective. Category standings change throughout the season as players heat up, cool off, return from injury, or cycle through fantasy rosters, so regular audits are more likely to uncover new opportunities.


