


There are few confidence boosts quite like having a hot first half to the fantasy baseball season. Hitters are raking. Pitchers are dealing. Every metric appears perfectly lined up coming out of the All-Star break.
“Appears” is, unfortunately, the key word here. Because this is fantasy sports, after all. And that dominant first half could also be marred with some debilitating red flags and can rear their ugly heads in August and September.
So was that scorching first half real, or a mirage? Here’s what fantasy managers need to know and how they should react as the second half rolls along.
Why a Hot Standings Position Can Still Be Fake
We aren’t saying that your hot start is for sure an illusion. It’s just a possibility savvy fantasy owners should know to look for.
The key is understanding that team-level success aggregates category-level luck. Factors like BABIP, HR/FB rate, and strand rate are heavily tied to luck and have a rapid regression rate that a blanketed stats scan won’t detect.
One or more games without a hit or a couple rough pitching starts won’t tank your entire fantasy season. But prolonged slumps can hurt your fantasy playoff chances if they aren’t caught quickly. The best course of action is knowing the difference between one bad day at the office and a full-blown slump.
Running the ERA-xERA Audit on Your Pitching Staff
Bruce Kluckhohn-Imagn Images
Athlon has covered variations upon this idea a few times. It’s hammered hard in our “Your Rotation Is Lying to You” segment.
To summarize: The gap between ERA (which fluctuates like crazy) and xERA can say a lot about how a pitcher is performing, but can also signal how often he is getting bailed out by his teammates. This is why looking at other major underlying stats like chase rate, whiff rate, walk rate, and strikeout rate are all important.
If ERA is low and well below xERA, that pitcher is exceeding expectations on solid mechanics and metrics. Think Phillies southpaw Cristopher Sanchez, whose Statcast profile shows his 2.71 ERA is better than his 3.31 xERA, and his chase rate (38.7%), whiff rate (32.4%), and walk rate (4.5%) are all in the 92nd percentile or better.
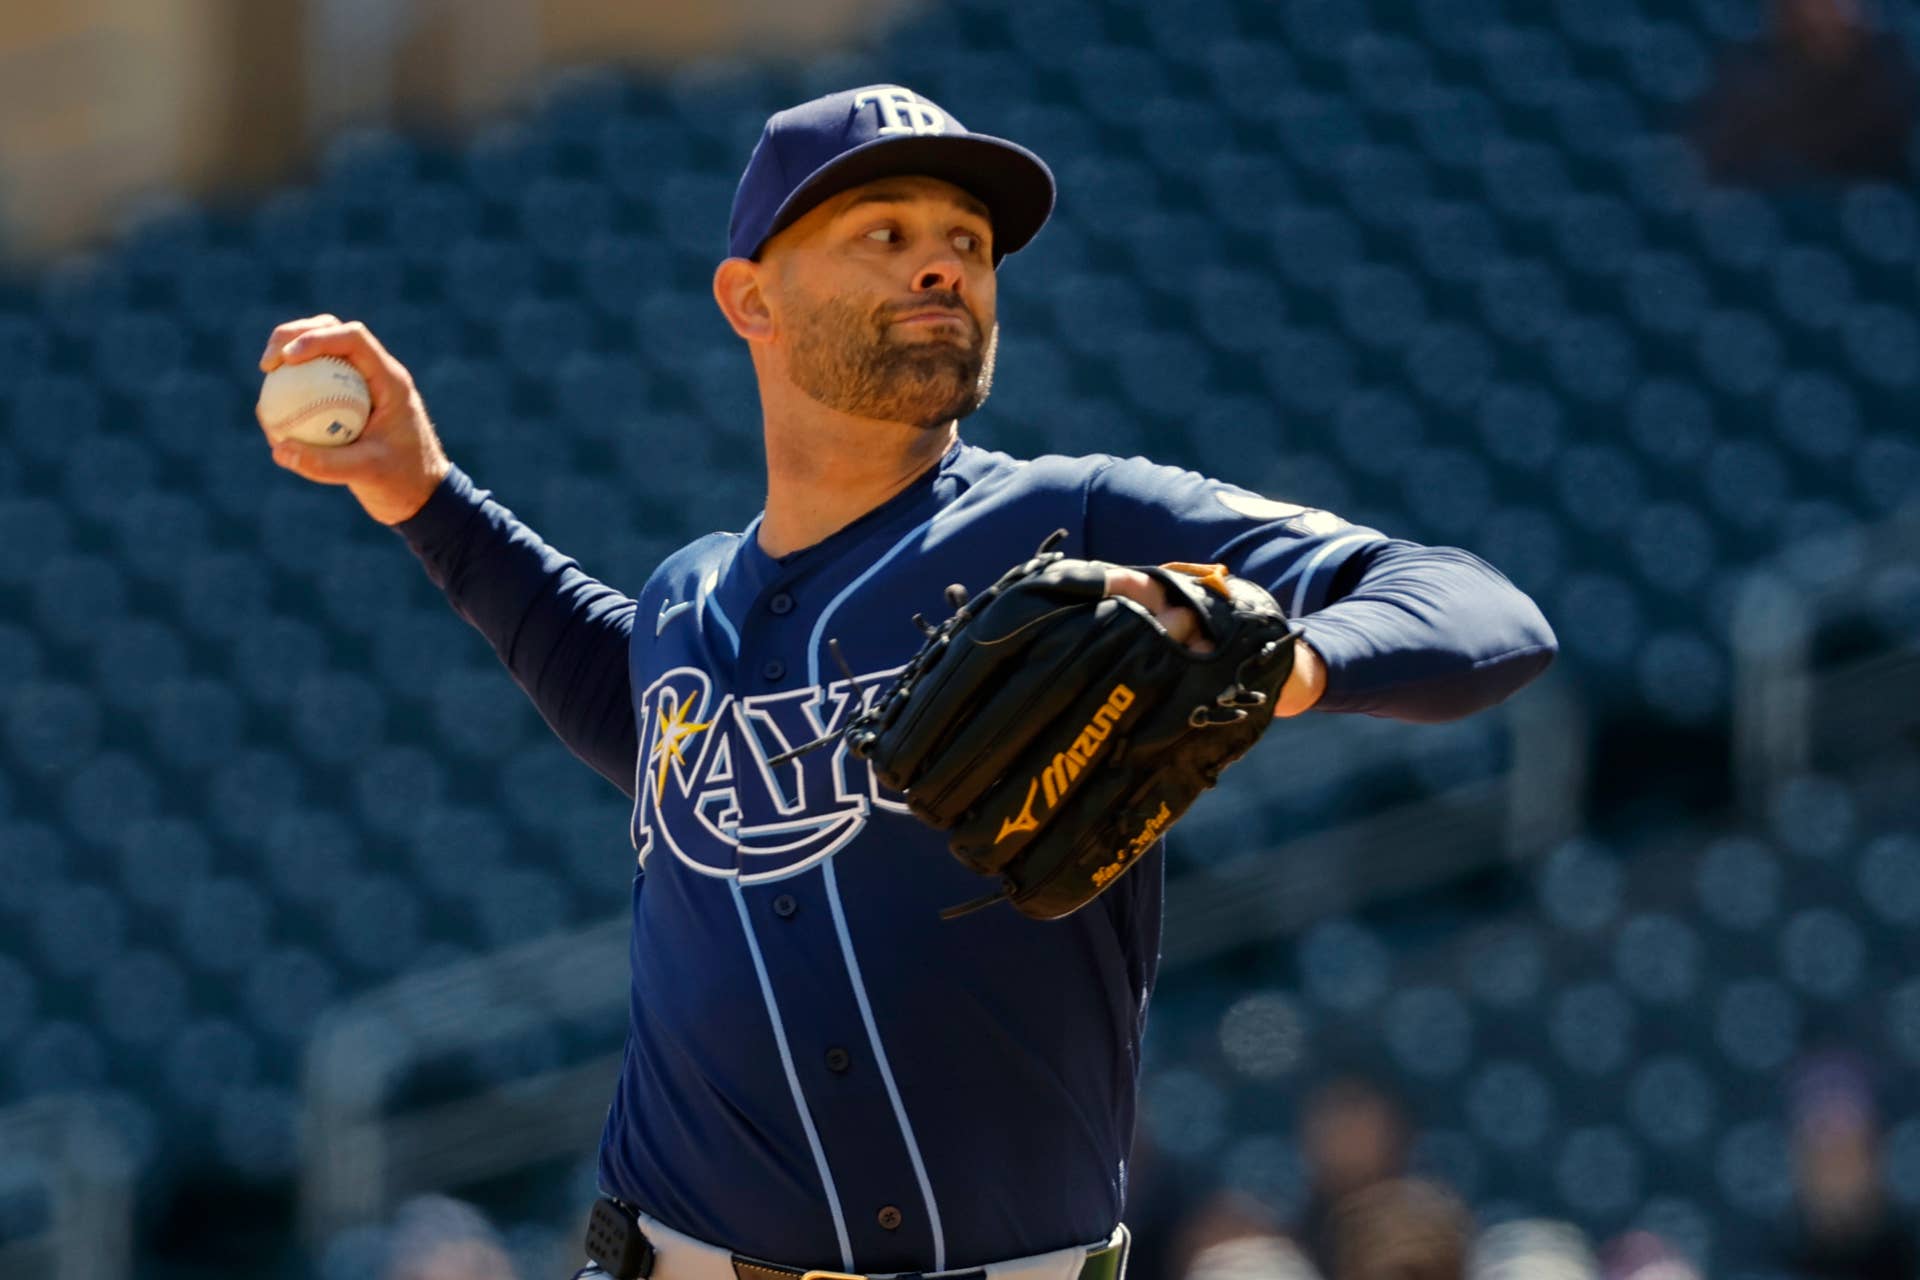
But, an ERA lower than xERA can also signal a pitcher who is lucky and not so much a fantasy must-start. Rays right-hander Nick Martinez is a good example of this. His 2.59 ERA is well below his 4.62 xERA, but his strikeout rate (13.7%) and whiff rate (17.7%) are in the second and third percentiles respectively, while his chase rate is tepid at 32.0%. This signals Martinez is getting a lot of help from Tampa Bay’s top-tier defense. (Which isn’t great for Martinez, considering how many sub-.500 teams the Rays have faced this season.)
Running the wOBA-xwOBA Audit on Your Hitters
Isaiah J. Downing-Imagn Images
The gap between wOBA and xwOBA is a similar story. Athlon covered it in our “Regression to the Mean” piece back in May, and it’s worth repeating.
If wOBA is higher than xwOBA, it can mean a hitter is crushing the ball and/or outrunning the opposing defense. It can also mean a hitter is getting lucky on weak contact and the opposing fielders are bumbling plays. Managers checking the wOBA-xwOBA gap should keep an eye on BABIP and homerun/flyball rate compared to underlying metrics like exit velocity, barrel rate, and hard-hit rate. This can help unmask a hitter’s skill versus luck.
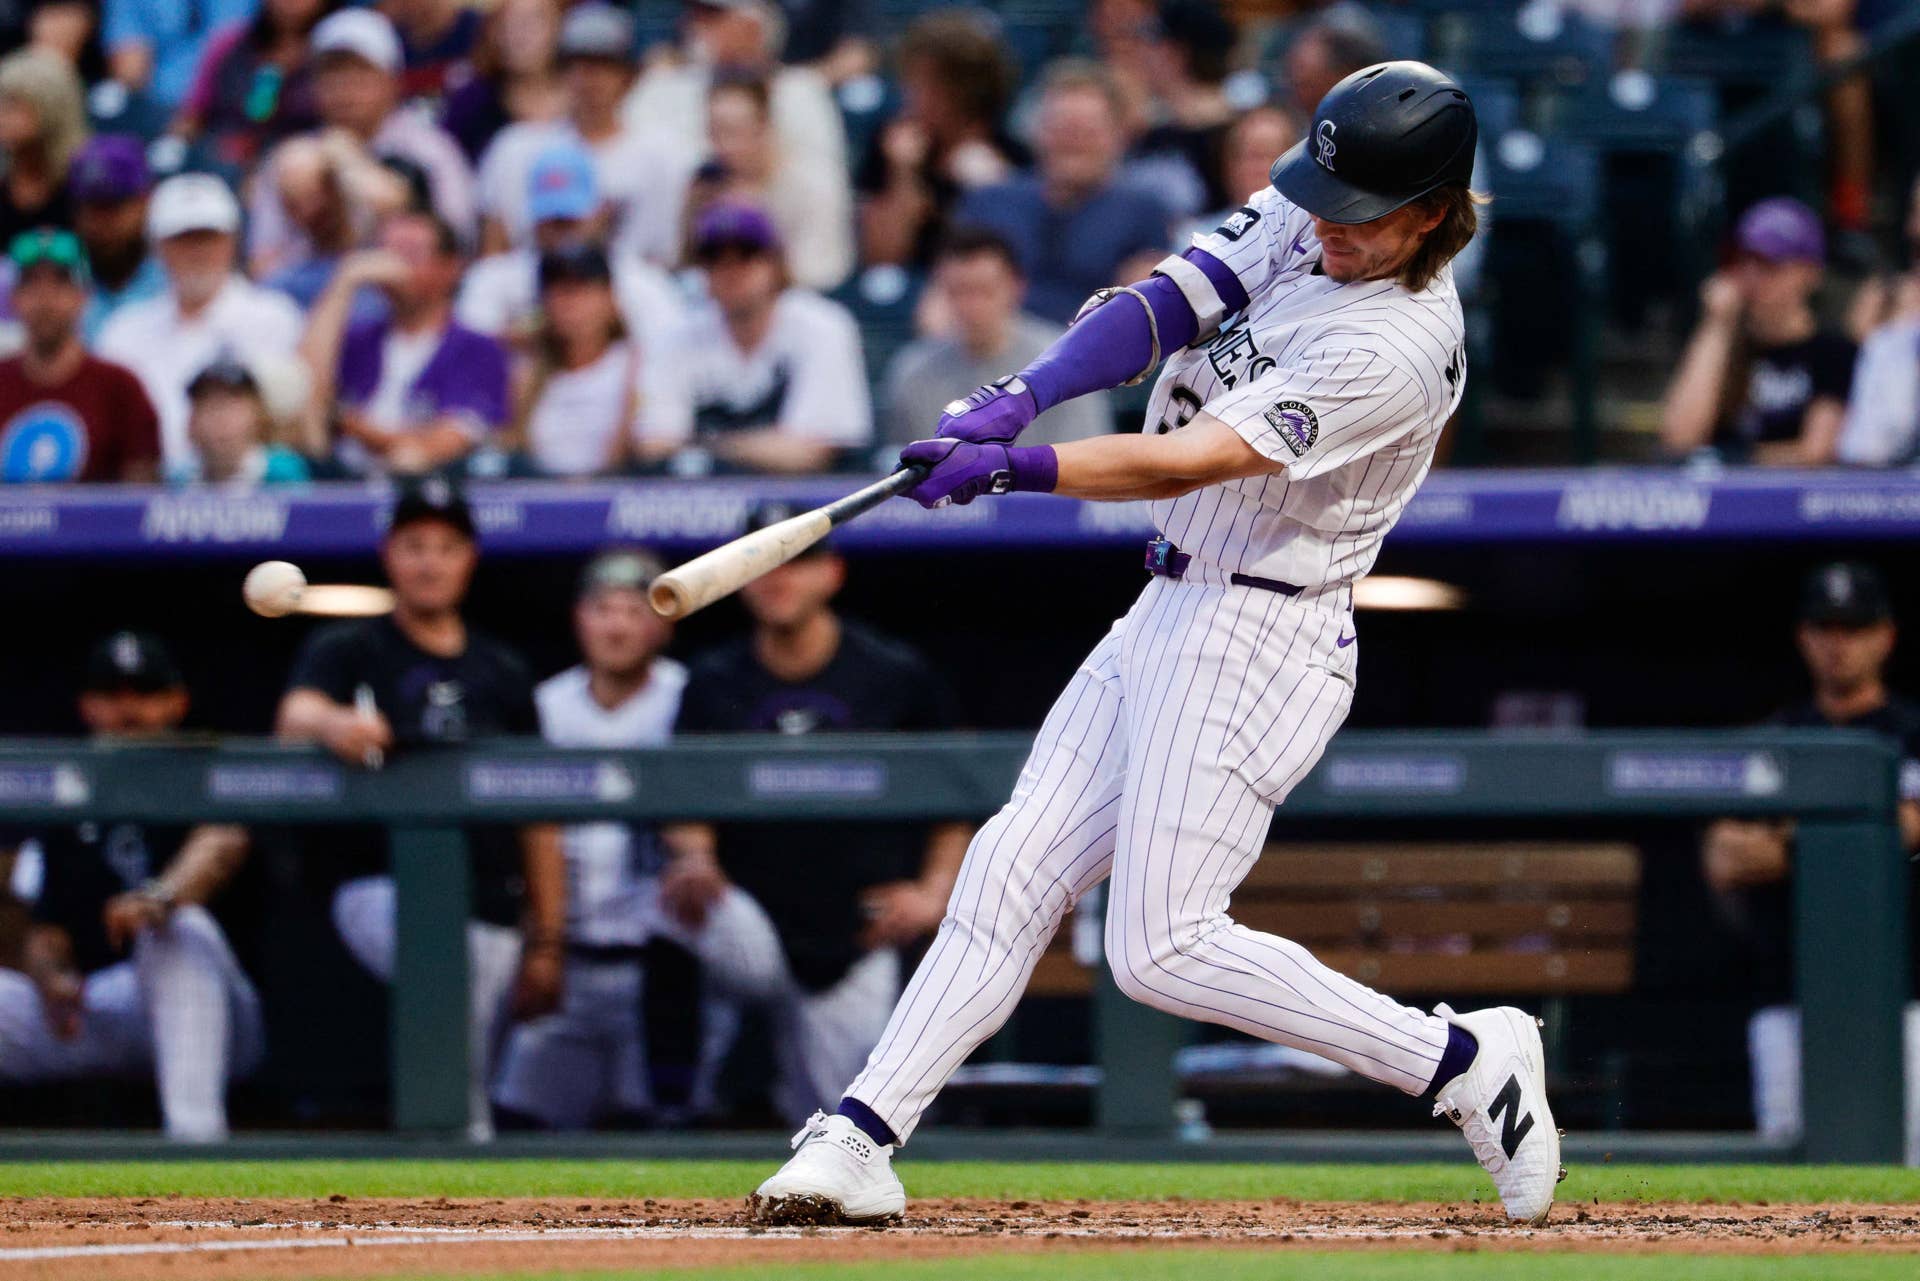
Take Rockies outfielder Jake McCarthy. He has a strong .305/.348/.511 slash line. However, FanGraphs shows there is a healthy gap between his wOBA (.369) and xwOBA (.312), and his .347 BABIP (which is above the league average around .300) signals more of his hits are falling on defensive errors or weak contact. Statcast confirms the contact quality, showing McCarthy’s hard-hit rate (25.7%) and average exit velocity (85.2%) are in the fourth and fifth percentile, while his 35.9% chase rate shows a lack of discipline at the plate.
Sell at Peak Value, or Hold With Confidence
Good fantasy managers look beyond the surface stats and identify these luck-driven stat gaps. Then they can decide whether to confidently hold a fantasy asset or sell high before the luck runs out. If first-half fantasy value is driven by overachieving or luck, owners should sell high immediately before the market catches up to those underlying red flags.
Looking for more examples of sell-high and hold candidates ahead of the MLB trade deadline? Athlon’s ongoing 2026 Fantasy Baseball coverage keeps you up-to-date on players and trends across the league.
Questions About Your Second Half, Answered
What does it mean if my team's ERA is well below its xERA?
A team ERA that sits well below its xERA can indicate the pitching staff's results are outpacing its underlying performance. While some pitchers support that gap with strong chase, whiff, strikeout, and walk rates, others may be benefiting from favorable defense or good fortune that could fade during the second half.
How is this different from a general sell-high board?
This approach focuses on evaluating your own roster rather than searching for trade targets across the league. By comparing ERA to xERA and wOBA to xwOBA throughout your lineup, you can better determine whether your team's first-half success is supported by underlying performance or inflated by luck.
Should I sell every player with a positive gap?
No. A positive gap should prompt a closer look rather than an automatic trade. Supporting metrics such as chase rate, whiff rate, strikeout rate, walk rate, exit velocity, barrel rate, and hard-hit rate can help determine whether a player's production is skill-based or more likely to regress.
Where do I find ERA-xERA and wOBA-xwOBA data?
FanGraphs and Statcast provide the underlying metrics needed to compare ERA with xERA and wOBA with xwOBA. Reviewing those numbers alongside supporting contact-quality and plate-discipline metrics gives a clearer picture of whether performance is sustainable.


