


Three True Outcomes rate blends a pitcher's strikeout, walk, and home run rates into one number that claims to measure what happens independent of the other nine players on the field. It's a real, teachable concept, and pitchers who post a high one tend to be good. But twenty-five years of matched pitcher seasons say the number has a flaw hiding inside its own definition, and there's a simpler stat sitting right next to it that does the job better.
What Is It?
TTO stands for Three True Outcomes: strikeout, walk, or home run. These are the only three outcomes in baseball that never touch a fielder. No defense, no BABIP, no sequencing luck, just the pitcher and the hitter, resolved entirely within the at-bat. TTO% measures the share of a pitcher's plate appearances that end one of those three ways. A pitcher sitting at 40 percent is finishing two out of every five at-bats without the other eight defenders ever getting involved.
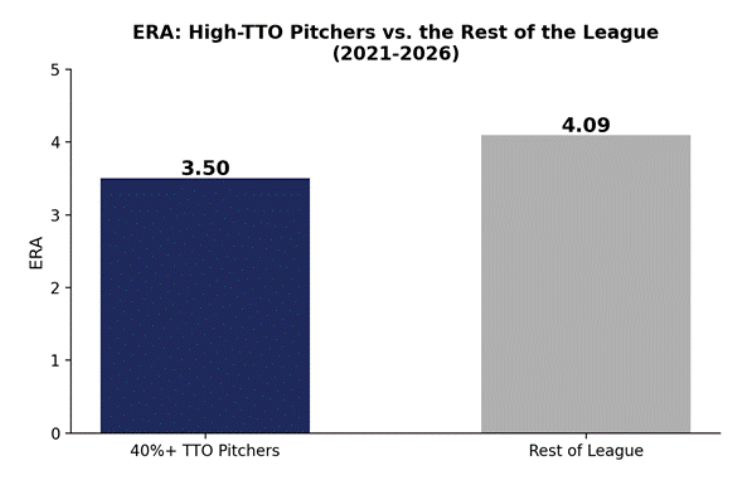
The number is not just a definition, it is a real, demonstrated pattern. Across 2021-2026 data, pitchers running a 40 percent or higher TTO% average a 3.50 ERA, against a 4.09 ERA for the rest of the league. Seventy percent of individual 40-plus TTO seasons in that window finished with an ERA under 4.00. The obvious worry, that stacking up so many home-run-eligible fly-ball at-bats should come with a tax in the form of more home runs allowed, doesn't show up in the data the way conventional wisdom suggests. High-TTO pitchers are, on balance, simply good pitchers.
What Can It Teach You?
James A. Pittman-Imagn Images
Here is where the number gets more complicated than its reputation. A correlation coefficient, often written as r, measures how tightly two numbers move together, running from -1 (perfectly opposite) to 1 (perfectly matched). An r above 0.7 is considered a strong relationship in most sabermetric work; anything above 0.9 is close to redundant.
TTO%'s correlation with a pitcher's own strikeout rate is 0.915, across twenty-five years of starting pitcher data. That is not two related stats. That is one stat wearing a second name. Walk rate and home run rate are baked into the blend, but the number's entire predictive weight is coming from the strikeout component riding along inside it.
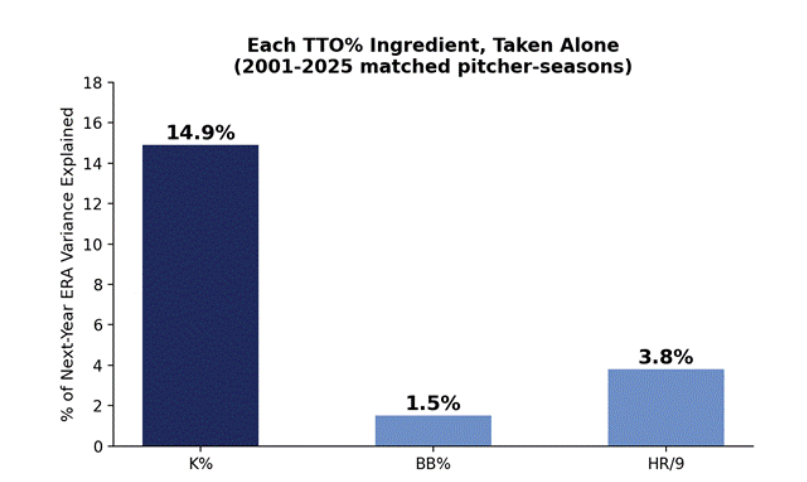
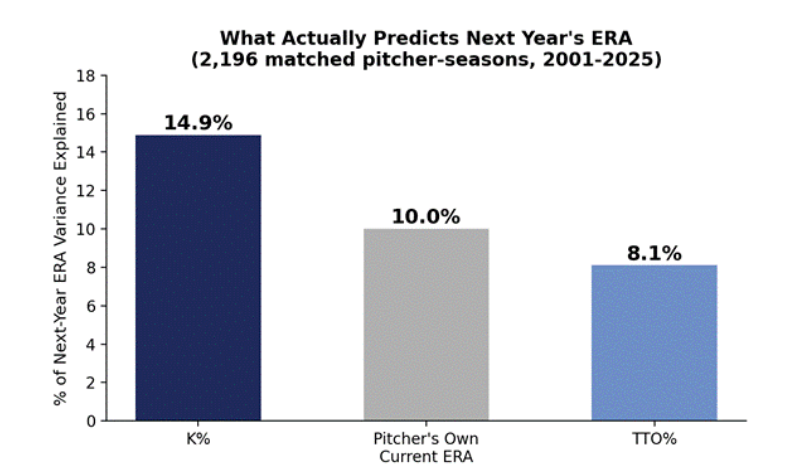
That matters because averaging a strong signal with two weak ones does not diversify a stat, it dilutes it. K% alone explains 14.9 percent of a pitcher's ERA the following season. BB% alone explains just 1.5 percent. HR/9 alone explains 3.8 percent. Folding all three into TTO% doesn't add BB%'s and HR/9's insight to K%'s, it waters K%'s real signal down with two components that are barely predictive on their own.
The single most useful fact in this entire study might be this: a pitcher's strikeout rate predicts his ERA the following season better than his own current-season ERA does, 14.9 percent of variance explained against 10.0 percent, a gap that widens to 19.7 percent versus 7.4 percent inside the Statcast era specifically (2015-2025). A pitcher's whiff rate is a better forecast of what's coming than the runs he's actually allowing right now.
Can It Predict the Future?
Jayne Kamin-Oncea-Imagn Images
The real test isn't how a stat correlates with itself in the same season, it's whether it forecasts what a pitcher does the following year. Built across 2,196 matched pitcher-seasons from 2001 through 2025 (2020 excluded for its short-season distortion), strikeout rate predicts next-year ERA at r = -0.385. TTO% manages only r = -0.284 over the same sample. That gap isn't noise. A Steiger's Z test, the standard statistical method for comparing two correlations drawn from the same sample, returns Z = -12.69, a result about as far from chance as sabermetric research gets.
There's a wrinkle worth a correction here. Among starting pitchers specifically, K% is stickier year to year than TTO% (0.807 versus 0.798), which actually reverses an earlier read on this exact question that mixed relievers into the sample alongside starters. Once the pool is narrowed to arms who start games, the gap flips, a real, explainable methodological wrinkle rather than a clean, universal rule.
None of this should be oversold. Even the best predictor in this study caps out around 15 percent of next season's ERA variance explained. Real, but bounded. Run a head-to-head test, pick the pitcher with the higher strikeout rate in year one and see who posts the better ERA in year two, and K% wins that matchup 64.3 percent of the time. That is meaningfully better than a coin flip. It is not a crystal ball.
So what is TTO% actually good for? Not as a lead signal, but as a confirming glance, mainly on the home-run-rate leg once strikeout rate has already made the case. The screen below applies exactly that logic: eleven pitchers whose TTO% climbed meaningfully from April through the full 2026 season, cross-checked against where their ERA and xERA actually landed.
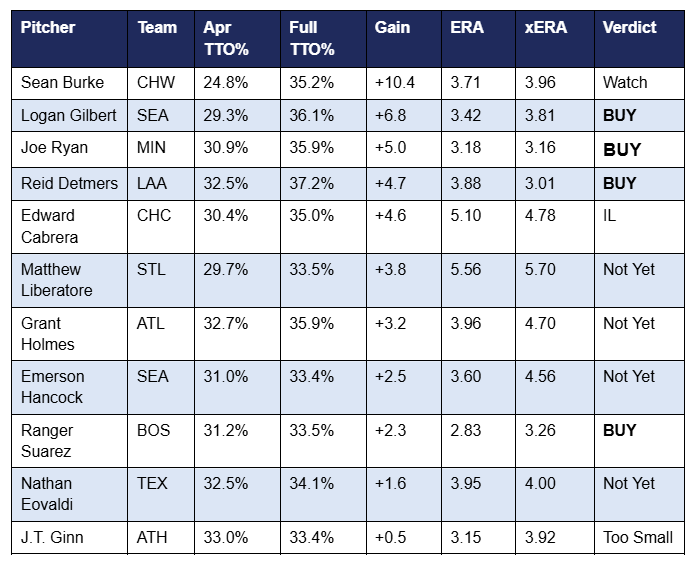
Joe Ryan, Reid Detmers, and Ranger Suarez are the confirmed buys here, pitchers whose TTO% gain and xERA both point the same direction. Sean Burke is the interesting maybe, a real arsenal change (a knuckle curve added in place of his old curveball, sinker usage roughly tripled) driving a genuine strikeout gain, but his xERA hasn't caught up to confirm it yet. Matthew Liberatore and Grant Holmes are the caution group, TTO% improved, but neither ERA nor xERA is backing it up, which is exactly the kind of gap this whole study says to take seriously rather than explain away. Edward Cabrera is on the IL for an undetermined amount of time, but does not look like a buy when he returns.
The takeaway for a fantasy roster is a two-step check, not a one-stat shortcut. Lead with strikeout rate. It's the stronger predictor, it's stickier year over year among starters, and it's simpler. Bring in TTO% only afterward, as a sanity check on the home-run-rate risk that strikeout rate alone doesn't fully capture. Three True Outcomes rate isn't a bad number. It's just not the number doing the actual work inside itself.
Questions About TTO, Answered
What does TTO% mean in baseball?
TTO% measures the percentage of a pitcher's plate appearances that end in a strikeout, walk, or home run, the three outcomes that happen without the defense ever touching the ball. A higher TTO% means more of that pitcher's at-bats are resolved independent of balls in play.
Is a high TTO% good for a pitcher?
Generally yes. Pitchers running a 40 percent or higher TTO% have averaged a 3.50 ERA against a 4.09 mark for the rest of the league, and the home-run risk that high-TTO profiles are assumed to carry doesn't show up as a consistent tax in the data.
Does TTO% predict a pitcher's future performance?
Some, but less than strikeout rate alone does. Across 2,196 matched pitcher-seasons, K% predicts next-year ERA more strongly than TTO% does, and the gap is statistically decisive rather than a close call.
Why does K% outperform TTO% if TTO% includes K% already?
Because TTO% blends K% with walk rate and home run rate, and those two components explain very little on their own, 1.5 percent and 3.8 percent of next-year ERA variance respectively. Averaging a strong signal with two weak ones dilutes the strong signal rather than adding to it.
Which 2026 pitchers does the data flag as buys using this framework?
Joe Ryan, Reid Detmers, and Ranger Suarez all show a real TTO% gain from April through the full season that is backed up by their xERA. Edward Cabrera, Matthew Liberatore, and Grant Holmes show the TTO% gain without the underlying results to confirm it yet.


