


Baseball is a series of random events. Small samples of the season are difficult to evaluate and statistics often take several weeks to several months or more of baseball to become useful. However, there are statistics that give you a picture of a pitcher’s talent level that are useful relatively early in the season. Herein, we examine when pitching stats start to matter.
The Science Behind Pitching Stat Stabilization
Baseball is a series of random events and the outcome isn’t always what might be expected. Every pitch, every swing, every hit, and everything that happens afterward is so random that predictability becomes statistically impossible within a small number of events (sample).
While it’s tempting to look at ERA as an evaluation for pitchers there are a number of problems with that statistic. The primary issue is the way that defense and other factors contribute to a pitcher’s ERA. DIPs theory, first put forth by Voros McCracken in the early 2000s, sought to prove that pitchers had little control over balls in play. Think of it this way: if a ball is hit into the field the pitcher has no control over the placement of the defenders. What should be a routine play can become an error, or a play that should have been easily made may not be. That hit and any subsequent runs that are scored are charged to the pitcher. DIPs theory stripped that defense out to focus on skills the pitcher could control and led to the creation of FIP, Fielding Independent Pitching. More on that later. For now, let’s look at how the science of statistics determines reliability of statistics.
How Researchers Determine Reliability
The mathematical science behind statistics uses the split-half correlation method. A large sample of plate appearances (PA), at-bats (AB), or balls in play (BIP) (depending on the statistic analyzed) is split evenly in half and compared. The correlation between the two sets is calculated and expressed as a number between 0 and 1. The closer to 1, the more you can rely on the statistic. A correlation of .70 is considered consistent enough to begin making player evaluations. The graph below shows the results for K% and BB%.
Keep in mind that just because you hit the magic .70 correlation, it doesn’t mean that there can be no change in the given statistic. That’s the inherent randomness of baseball events rearing its head again. It just means that you can rely on those changes to be close enough for early-stage fantasy baseball evaluation purposes. You can read more about the calculations behind this research here.
Which Pitching Stats You Can Trust Right Now
Katie Stratman-Imagn Images
Fast-Stabilizing Metrics in Mid-April 2026
Strikeout rate (K%) and walk rate (BB%) are the first statistics to stabilize for pitchers, same as it is for hitters. These statistics are considered within the pitcher’s control and are therefore thought of as skill metrics. Two additional metrics that are within a pitcher’s control are home runs allowed and hit by pitch. Every other metric requires a rather large sample to become relevant. These four metrics are the basis of FIP. It strips out defense entirely and is scaled to ERA so it can easily be used for comparison purposes.
Think of FIP as the starting point for research into a pitcher’s skill set. Most pitchers will have a FIP that looks similar to their ERA. So, it is necessary to also look at the individual components of FIP — strikeout rate, walk rate, home runs allowed, and hit by pitch, to get a better sense of how a pitcher is performing.
Along those lines, another metric to look at combines strikeout rate and walk rate; K%-BB% will give you a single number you can use to evaluate a pitcher. The league average for this stat changes from year to year and can change during the season as well. Here’s a table using the current range of K%-BB% to see what that might look like.
| Tier | K% | BB% | K%-BB% |
|---|---|---|---|
League Best (Jacob Misiorowski) |
37.2 |
9.5 |
27.7 |
Above Average (Chase Burns) |
28.3 |
8.7 |
19.6 |
League Average |
22.2 |
9.6 |
12.6 |
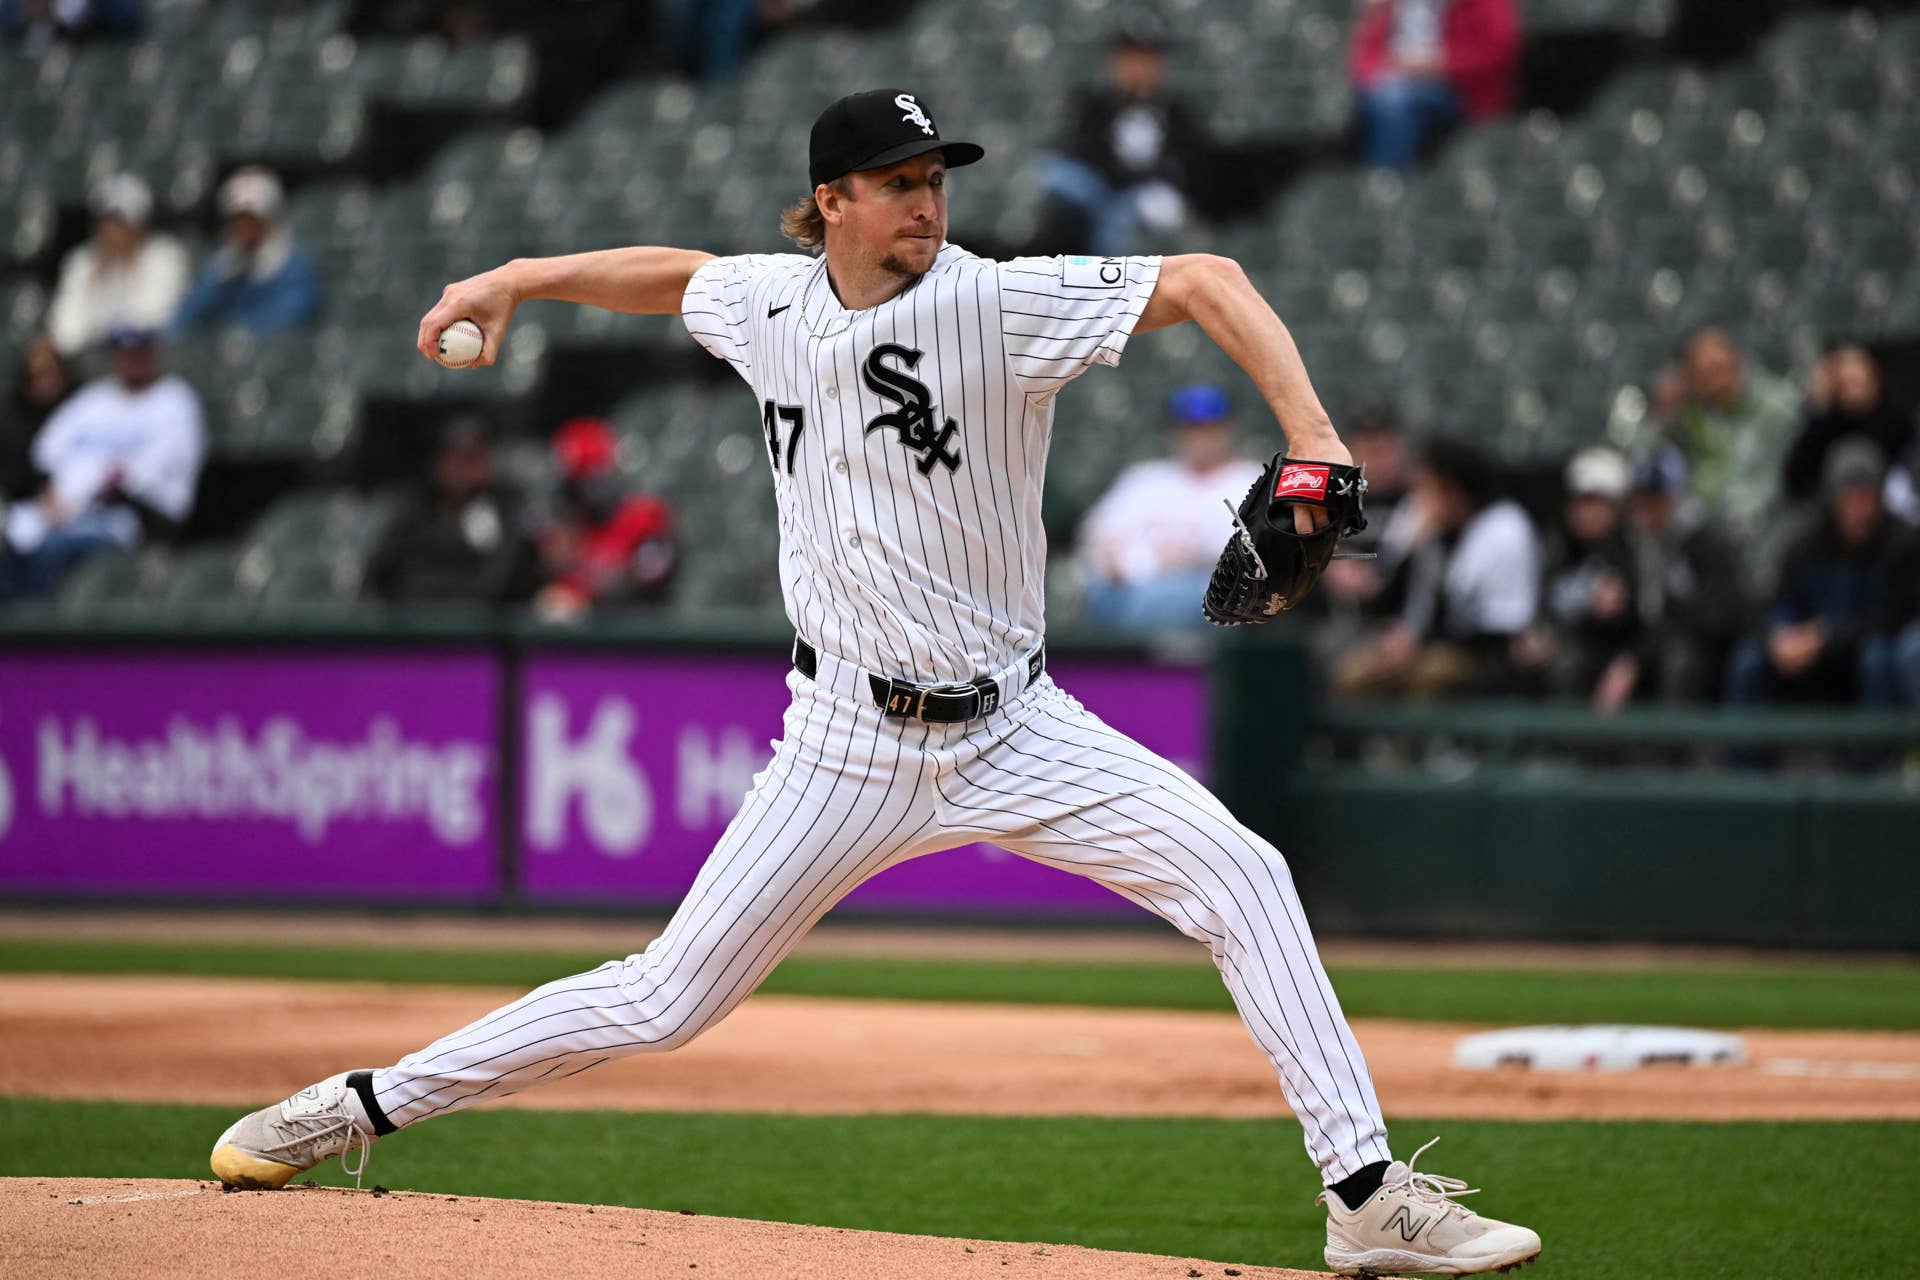
Below Average (Erick Fedde) |
16.4 |
8.2 |
8.2 |
League Worst (Jack Kochanowicz) |
16.3 |
12.2 |
4.1 |
Another thing worth mentioning here is that the percentage stats are a better way to compare pitchers than using strikeouts or walks per nine innings. The reason for this is that the percentage stats are measuring the percentage of batters faced rather than the percentage of outs. This allows an apples to apples comparison of pitchers.
One other metric you might consider using to evaluate pitchers is CSW%, which is called strikes plus whiffs. You can find out more about this metric here.
Metrics That Still Require Patience
ERA, BABIP, and Long-Tail Luck Factors
ERA is a wonderful statistic because it’s easy to find. However, because it includes all kinds of noise from luck, defense, and events that are not within a pitcher’s control, it’s nearly useless when evaluating a pitcher. When used with FIP, ERA can tell you something about the team environment in which a pitcher is working. However, it can’t be used across teams and should not be used to evaluate an individual pitcher outside of providing the team defense context.
BABIP (Batting Average on Balls in Play) is another metric that isn’t very useful for evaluating pitchers. It takes more than 2000 balls in play to get a picture of a pitcher’s BABIP talent level. Even then, since a pitcher has almost no control over what happens when a ball is hit in play, it tells us more about the defense behind the pitcher than anything else. BABIP is better used to evaluate hitters, who have more control over BABIP than pitchers do. Coincidentally, it takes about 800 balls in play to get a measure of a hitter’s BABIP talent.
Pitching Stats Sample Size Questions, Answered
When do pitching stats start to matter in fantasy baseball 2026?
Strikeout rate stabilizes after roughly 70 batters faced and walk rate after 170 batters faced, often by mid-April. FIP becomes reliable around 200-300 batters faced while ERA and BABIP need several hundred more before they reflect true talent.
How many batters faced until K% and BB% stabilize for fantasy pitchers?
Strikeout rate stabilizes around 70 batters faced and walk rate around 170 batters faced according to FanGraphs and Baseball Prospectus research. By the second or third week of 2026 many rotation regulars already meet these thresholds.
When does ERA become reliable in 2026 fantasy baseball?
ERA typically needs about 630 batters faced to stabilize, meaning it remains heavily influenced by luck and defense through the first two months of the season. Managers should weigh FIP far more heavily early on.
What is the stabilization point for FIP and HR rate in fantasy baseball?
FIP stabilizes much faster than ERA because it removes defensive luck. Home-run rate needs around 1320 batters faced, but FIP itself gives usable insight by late April for most starters.
Should I trust early 2026 BABIP numbers for fantasy pitching decisions?
No. BABIP requires roughly 2000 balls in play to stabilize and is heavily luck-driven early. Focus instead on K%-BB% and FIP until at least June.


